

OWON XSA1000P Series
The 10.4-inch benchtop range: 9 kHz to 1.5, 3.2, 3.6 or 7.5 GHz, 1 Hz resolution bandwidth, −160 dBm/Hz DANL, 200+ EMI templates and a tracking generator. From €905.
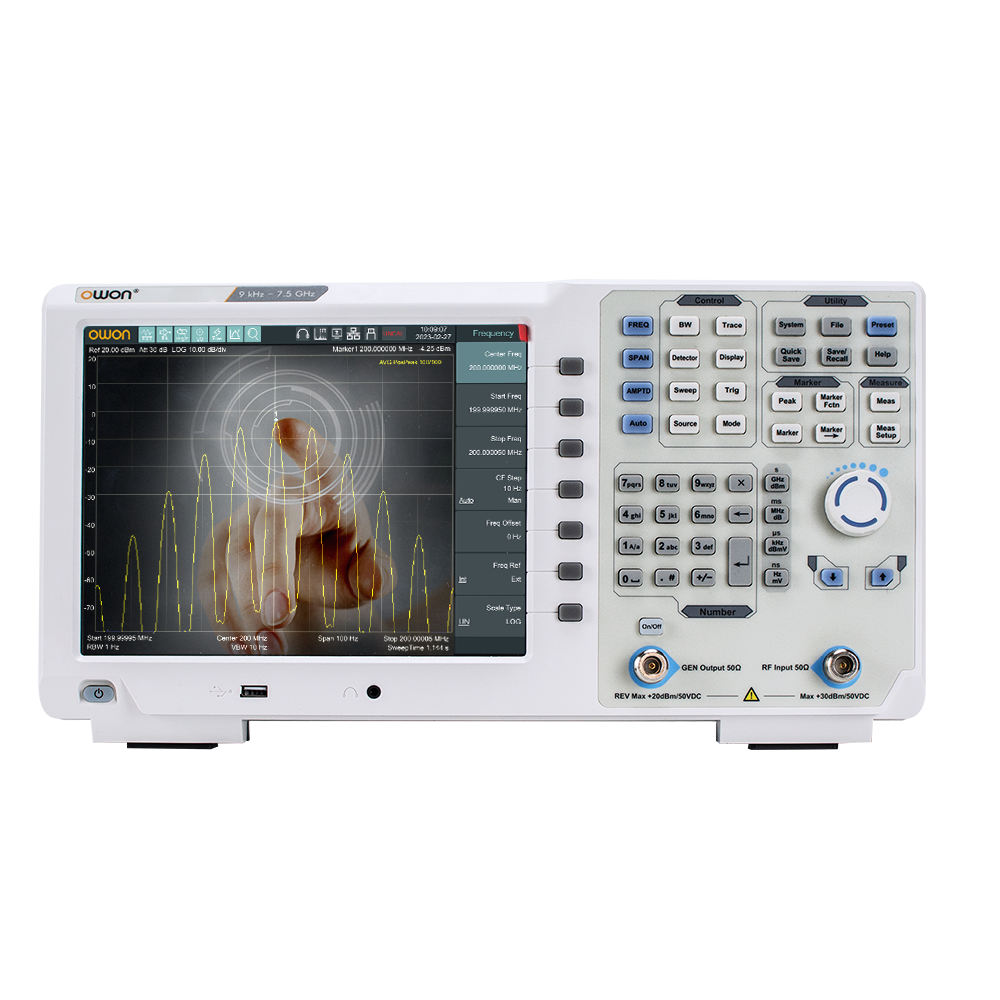
One platform, four decisions already made for you
The XSA1000P is OWON’s main benchtop analyser range and the step up from the XSA800: a larger 10.4-inch 1024×768 multi-touch display, a wider choice of frequency ceilings — 1.5, 3.2, 3.6 or 7.5 GHz — and more measurement depth, in a 421 mm chassis.
All four models share 1 Hz resolution bandwidth, −160 dBm/Hz displayed average noise level, <0.7 dB amplitude accuracy and −106 dBc/Hz phase noise at 1 GHz. On top sit 200+ built-in EMI templates, full-band signal auto-location, spectrogram and waterfall views, audio demodulation, modulation analysis and pass/fail limit testing with an alarm.
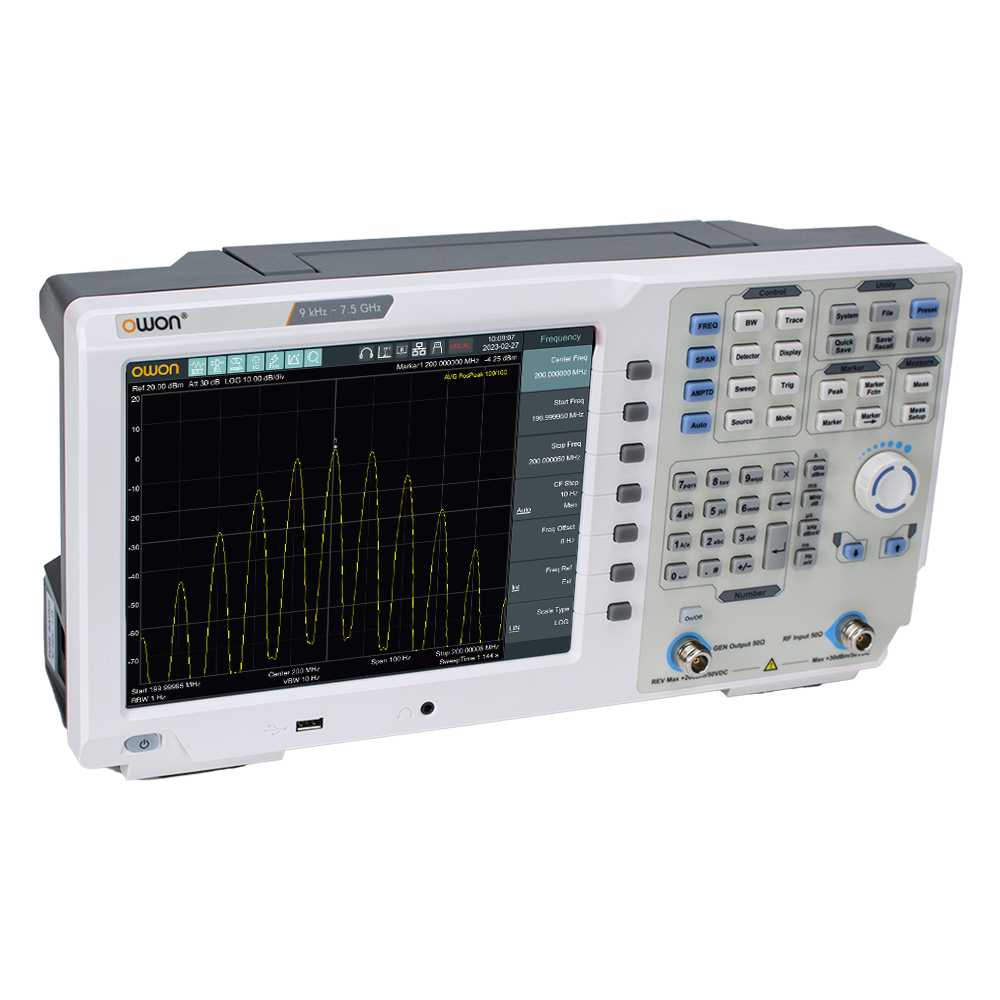
Why the XSA1000P
Selectivity, sensitivity and EMI tooling — the three things that decide whether an analyser is actually useful.
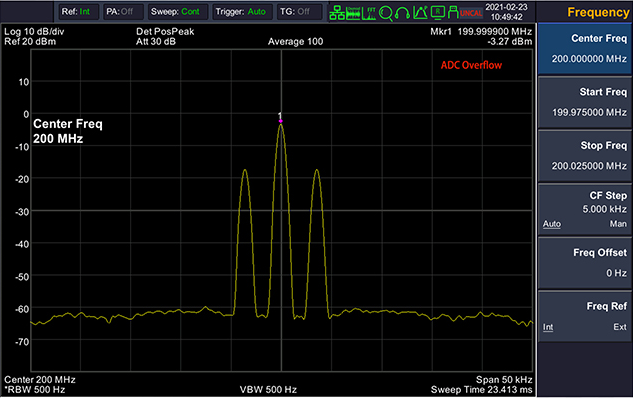
1 Hz resolution bandwidth
Resolution bandwidth from 1 Hz to 1 MHz resolves signals that sit almost on top of each other, with −160 dBm/Hz DANL to find the ones that are barely there at all.
Resolution bandwidth (RBW) is the width of the analyser’s internal filter as it steps across the span. It decides how close together two signals can be and still appear as two peaks rather than one hump.
A narrow RBW separates crowded signals and lowers the noise floor, because less noise power falls inside the filter — roughly 10 dB for every factor of ten. The cost is sweep time: halving the RBW makes the sweep about four times longer, so you choose the widest filter that still resolves what you need.
In practice: Looking for a spurious emission 15 kHz away from a strong carrier: at 10 kHz RBW it hides inside the carrier’s skirt. Drop to 1 kHz and it separates cleanly, and the noise floor falls about 10 dB with it.
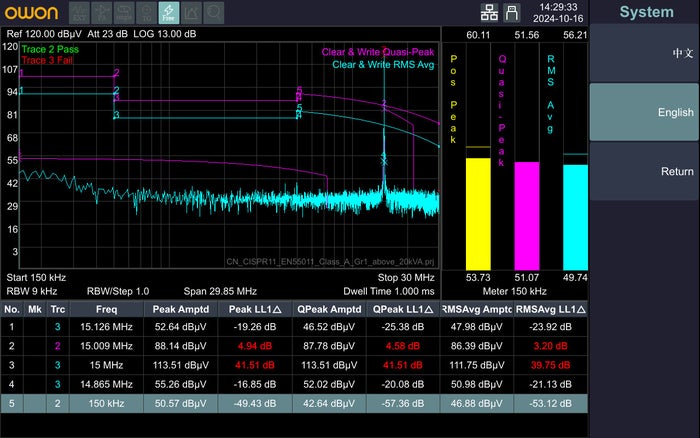
200+ EMI templates
Built-in EMI limit templates and −6 dB CISPR bandwidths (200 Hz, 9 kHz, 120 kHz, 1 MHz), plus free OWON EMC testing software — pre-compliance work out of the box.
EMI pre-compliance mode swaps the normal measurement bandwidths for the CISPR-defined ones — 200 Hz, 9 kHz, 120 kHz and 1 MHz at −6 dB — and adds stored limit lines to test against.
A formal EMC test house charges by the day and books weeks ahead. Finding a failing harmonic on your own bench first, with the same bandwidths and the same limit lines the lab will use, turns a failed booking into an afternoon of filtering.
In practice: A switch-mode supply radiating at 150 MHz shows 6 dB over the EN 55032 Class B line. You add a common-mode choke and re-scan against the stored template until it passes, before booking the chamber.
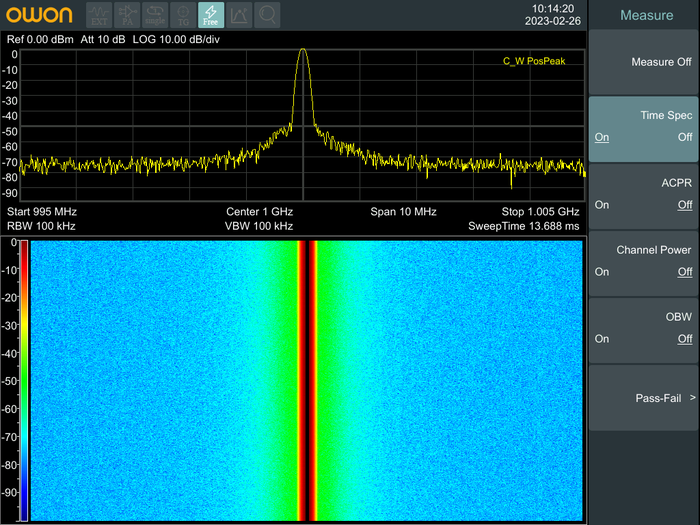
Spectrogram & waterfall
Watch a band over time in a waterfall plot to catch intermittent and hopping signals that a single sweep would never show you.
A spectrogram (waterfall) plots frequency horizontally and time vertically, with colour showing amplitude — so you watch a band change over seconds or minutes instead of seeing only the instant the sweep passed.
A single sweep shows what was there at that moment. Signals that hop, burst or appear intermittently are invisible to it far more often than not. The waterfall turns "it happens sometimes" into a pattern you can point at and time.
In practice: An intermittent 2.4 GHz dropout: the waterfall shows a wideband burst repeating every few seconds, its timing matching a nearby machine’s duty cycle — which a single sweep would only catch by luck.
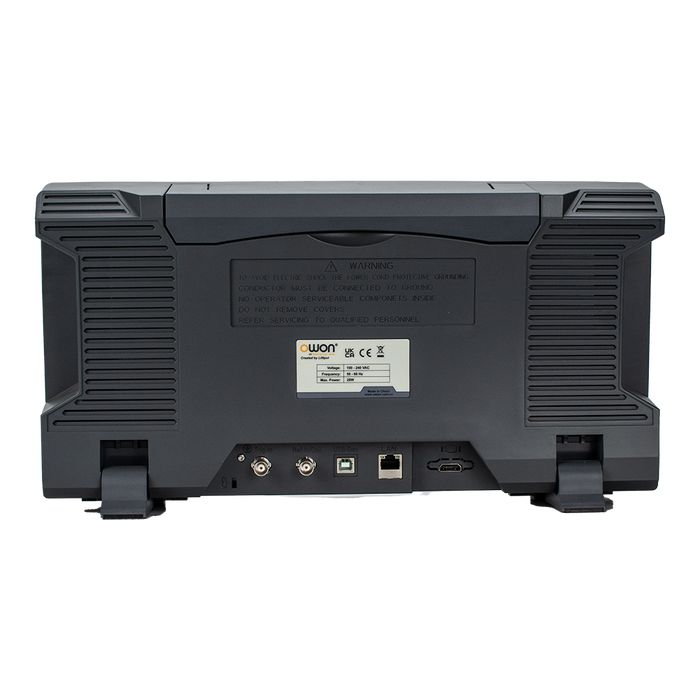
Connect & automate
LAN 10/100, USB host and device, HDMI 1.4 and SCPI remote control, with 256 MB of internal storage and an 18-month calibration interval.
LAN, USB and the SCPI command set let the instrument be driven from a PC, and its screen and data pulled off it, without anyone standing at the front panel.
Anything you do twice you will do a hundred times. SCPI over LXI, USBTMC or a raw socket means a test sequence runs unattended and logs to file, and LabVIEW or IVI drivers drop it into a rig you already have.
In practice: A production check that sweeps five bands, compares each against a limit line and writes pass/fail to CSV — the operator presses one key instead of setting the analyser up five times per unit.
Who it’s for & best applications
- RF and wireless design up to 7.5 GHz
- EMC pre-compliance with the built-in templates
- Wi-Fi, Bluetooth and cellular band work
- Antenna and filter measurement with the tracking generator
- Labs that need a bigger screen and deeper measurement set than the XSA800
- Channel power, ACPR, occupied bandwidth and CNR
- Harmonic and spurious searching to 7.5 GHz
- EMI pre-compliance scans against stored limit lines
- Spectrogram monitoring of a busy band
- AM / FM / PM modulation analysis and audio demodulation
Choose your model
The models differ in one thing: the top of the frequency range, and whether you take the tracking generator option. Resolution bandwidth, sensitivity, display and measurement set are identical across the series. Click any model for its full specifications and to buy.
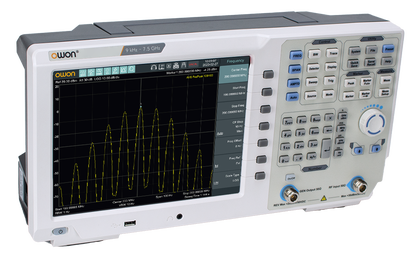
XSA1015P-TG
XSA1032P-TG
XSA1036P-TG
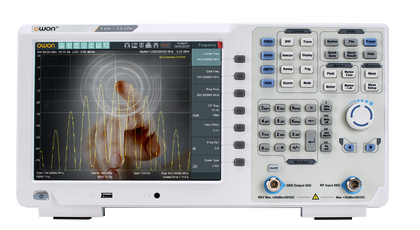
XSA1075P
Prices shown are for the analyser on its own. The tracking-generator version is selected on the product page — it adds a signal source that sweeps in step with the analyser, turning the instrument into a scalar network analyser for filters, cables and antennas.
Specifications
Shared across the XSA1000P Series; only the frequency range and the tracking-generator range depend on the model.
| Frequency & amplitude | |
| Frequency range | 9 kHz to 1.5 / 3.2 / 3.6 / 7.5 GHz (model) |
| Frequency resolution | 1 Hz |
| Reference frequency | 10 MHz, <1 ppm initial accuracy |
| Resolution bandwidth (−3 dB) | 1 Hz to 1 MHz, 1-3-5-10 steps |
| EMI bandwidth (−6 dB) | 200 Hz, 9 kHz, 120 kHz, 1 MHz |
| DANL | −160 dBm/Hz |
| SSB phase noise | −106 dBc/Hz @ 1 GHz, 10 kHz offset |
| Amplitude accuracy | < 0.7 dB |
| Amplitude accuracy, preamp on | ±1.0 dB (fc ≥ 50 MHz) |
| EMI templates | 200+ built in |
| Features, control & general | |
| Tracking generator (option) | 100 kHz to model max · −40 to 0 dBm · 1 dB steps · ±3 dB flatness |
| Measurements | Channel power, ACPR, OBW, CNR, harmonic, spectrogram, pass/fail |
| Modulation analysis | AM, FM, PM · audio demodulation |
| Display | 10.4-inch TFT, 1024 × 768, multi-touch |
| Interfaces | LAN 10/100 · USB host + device · HDMI 1.4 |
| Storage | 256 MB internal flash · USB stick (not supplied) |
| Power | 100–240 V AC, 50/60 Hz, 28 W nominal |
| Operating temperature | 0 °C to 50 °C |
| Dimensions / weight | 421 × 221 × 115 mm · ≈ 5.0 kg |
| Calibration interval | 18 months recommended |
From the official OWON XSA1000P Series specification sheet; subject to change, errors & omissions excepted.
In the box
Every XSA1000P ships with a power cord, quick guide, USB cable and an N-to-BNC adaptor.
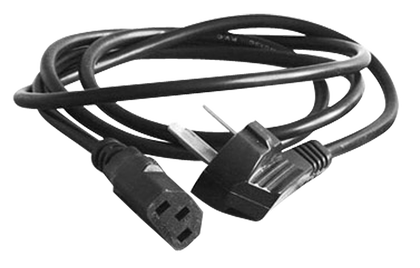

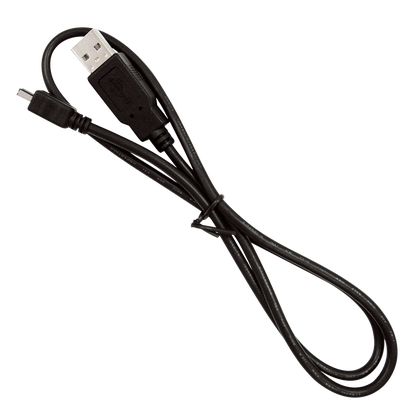
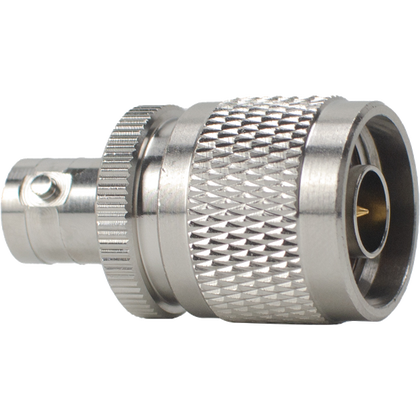
Documentation and PC software are free downloads below. Box contents subject to final delivery.
Related ranges
Other OWON spectrum analysers, if this one is not quite the right shape.
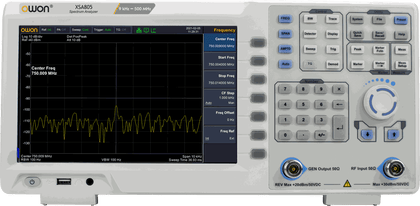
XSA800 Series
Entry-level 9-inch benchtop analysers to 1.5 GHz, with 1 Hz RBW and an optional tracking generator.
View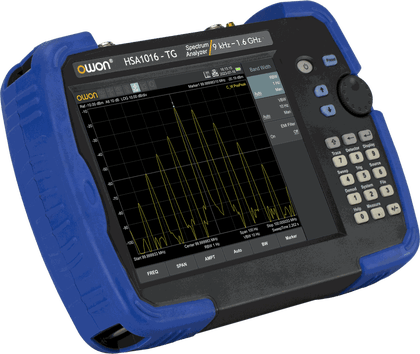
HSA1000 Series
The same measurement performance in a battery-powered 8-inch handheld with standard GPS geo-tagging.
ViewAccessories & probes
Near-field probe sets, adaptors and cables for RF and EMC work are in our accessories store.
ViewNot sure which model you need?
Tell us the highest frequency you have to measure and whether you need the tracking generator — we will tell you which XSA1000P fits, or point you at a different range if this one is the wrong tool.
Downloads
Official OWON documentation and Windows PC software for the XSA1000P Series.
Files are hosted on the OWON server and open in a new tab. Also available: the full XSA1000P Series factory product page.